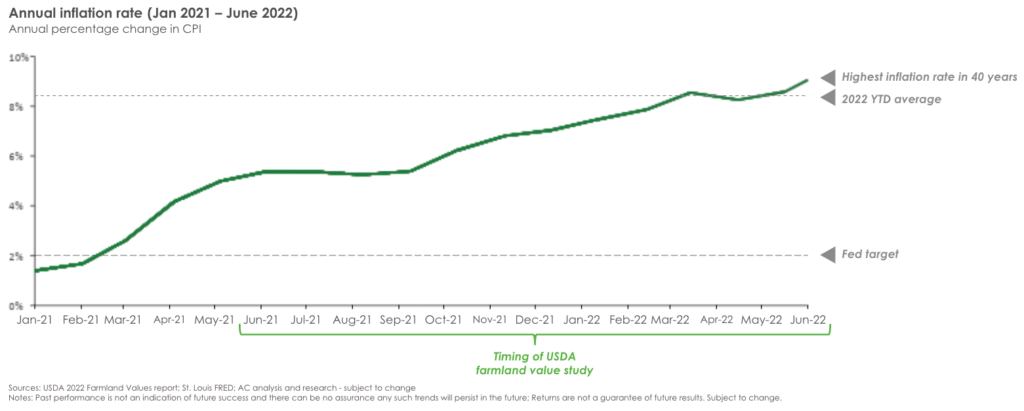
This year’s USDA Farmland Value report allows for a unique case study in asset value performance during a high-inflation period. The US experienced its highest 12 month stretch of inflation in the last 40 years as US YoY CPI growth exceeded the Fed’s 2% target in March 2021, grew steadily to 5.4% in June, and has remained at 6–9% ever since. The last time the US experienced annual inflation above 4% was 1991, and we have not experienced inflation over 6% since the early 1980s. So, while acknowledging one year of data is, well, limited, it’s what we have to work with as we evaluate the effectiveness of farmland as an inflation hedge.
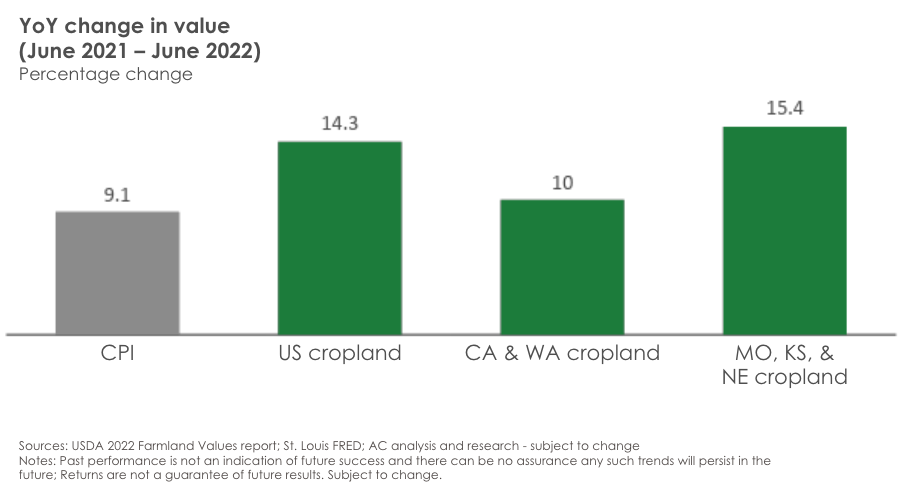
There is one clear takeaway from the report: cropland values increased significantly over the last year. Overall, US cropland value increased by 14.3% from June 2021 to June 2022.
Agriculture Capital focuses primarily on permanent crops (i.e., fruit & tree nut crops) and while the report does not separate permanent cropland from annual cropland, we did our best to parse through the data to arrive at rough proxies. Over 40% of California and Washington farmland acreage is in fruit & tree nuts, which stands in stark contrast to basically every other state. CA and WA irrigated cropland value increased by 10% over the last year while irrigated cropland in Missouri, Kansas, and Nebraska (representative of a more commodity-focused production base) increased in value by 15%. There are several plausible explanations for the disparity; severe drought conditions in the West almost certainly played a role (more coming on this topic), but it is difficult to reach conclusions without more granular data. Overall, long-term appreciation is similar across regions, and the point remains: farmland appears to be an effective inflation hedge.
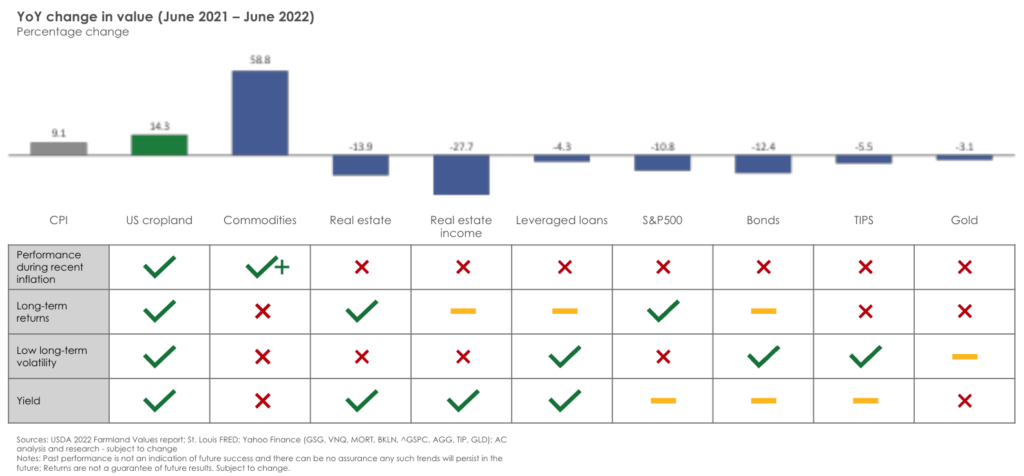
With that point firmly established, the next logical question is: ‘how did farmland perform relative to other asset classes?’ Once again, results are encouraging.
Without over-thinking it, we compared cropland performance against a handful of other traditional inflation hedge investment strategies. While performance over the last year is obviously important, we know that investors cannot hope to combat the negative impacts of inflation after inflation has arrived. With that in mind, an ideal inflation hedge should also deliver strong long-term risk-adjusted returns and cash yield as it sits in a portfolio waiting for its time to shine.
Considering that evaluation framework (short-term performance amid inflation, long-term performance, and yield), farmland once again appears to be an effective inflation hedge that provides multiple portfolio benefits. US cropland values not only grew at a higher rate than CPI but also outperformed nearly all other asset classes while also delivering strong long-term risk-adjusted returns and yield.
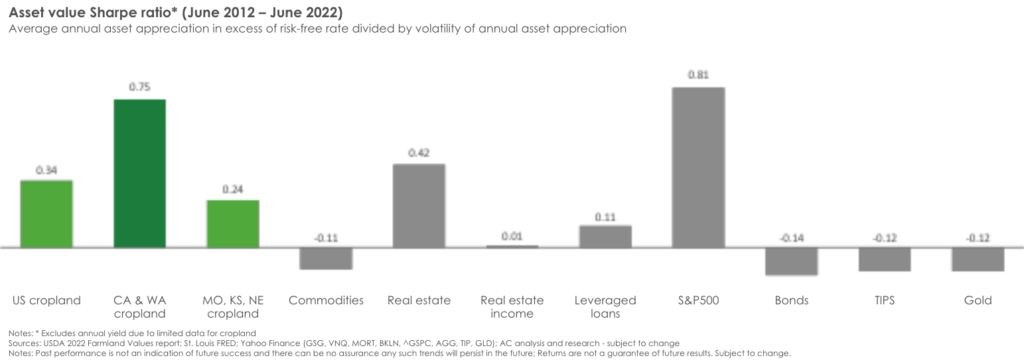
Looking at risk-adjusted asset appreciation over a longer period, farmland is a top performer again. Specifically, with a 10-year Sharpe ratio of 0.34 (considering asset value only), farmland investments only trailed real estate and public equities. The results of the analysis are not surprising. Stocks enjoyed the longest bull market ever over the last decade-plus. If we were to take a longer look back, the farmland Sharpe ratio would improve while stocks and real estate Sharpe ratios would decline. Finally, permanent crops seem to have a positive impact on Sharpe ratios relative to row crops; the California & Washington cropland Sharpe ratio for the last 10 years outperformed real estate and performed in-line with the S&P-500.
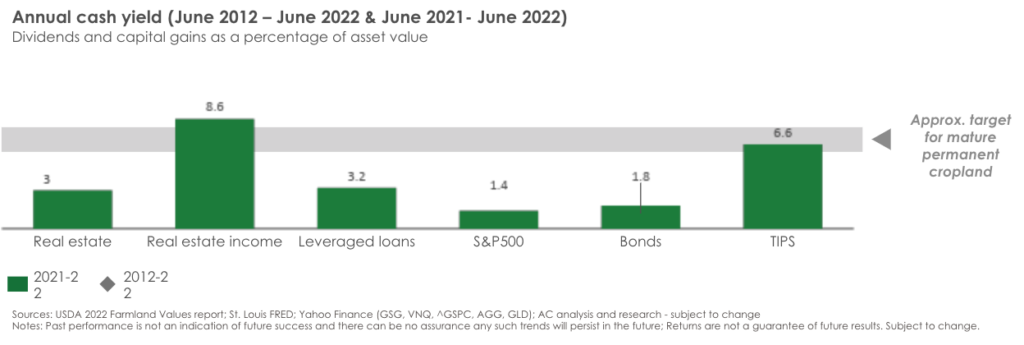
Yield is trickier to evaluate. It is simple enough to calculate yield of ETFs, but data for private farmland are more opaque. For those who have access, we highly encourage a glance at the quarterly farmland income return and asset appreciation returns reported by the NCRIEF Farmland Index. In the meantime, we stand behind farmland cash yield performance for a few reasons. First, food prices are a primary driver of broader inflation. Without diving deep into the numbers, we know that higher input costs are partially or fully offset by price increases. Second, AC currently expects investments in mature permanent cropland to yield at least 6%, which compares favorably vs. other inflation hedge investments. From June 2021 to June 2022, only Real Estate Income (MORT) and TIPS matched that level of yield performance.
So, what should you make of this quick analysis? Without getting carried away by one year of data, we believe farmland belongs in portfolios of investors with long investment horizons. The asset class provides strong risk-adjusted total returns, yield, and resilience when other asset classes experience decline. However, farmland is not liquid, and performance improves with time. Patience is not necessarily required, but it helps.
Finally, there is a key point that the numbers above do not illustrate: not all farmland investment strategies are the same. For example, investors are more likely to realize asset appreciation when their asset managers restore natural systems (think soil health) and grow food that is in demand. Similarly, farmland assets are more likely to exercise pricing power and realize cash yield when they are integrated with processing and distribution businesses and contribute to a broader scaled crop platform. All of the above is difficult to execute, but the effort is worthwhile.
